Analyzing website memory dumps
 When debugging a production website, Application Insights sometimes is not enough, and you need more powerful tools.
Going through a memory dump is both a blessing and a curse. To be fairly honest, it is mostly a curse. Today one of our services experienced multiple “OutOfMemoryExceptions”. Instead of doing what we mostly do, restarting the hell out of that server, we were a bit smarter and asked Azure to give us a memory dump. The memory dump led us to a specific web request causing a quasi-memory-leak by putting lots of objects (530 038 to be exact) in memory. What follows is how we did it.
Step one: Getting the memory dump
Identifying the correct instance
Our service runs on multiple instances, and we needed the memory dump for that specific instance. You can find the right instance easily by going to the live metrics stream of the connected Application Insights.
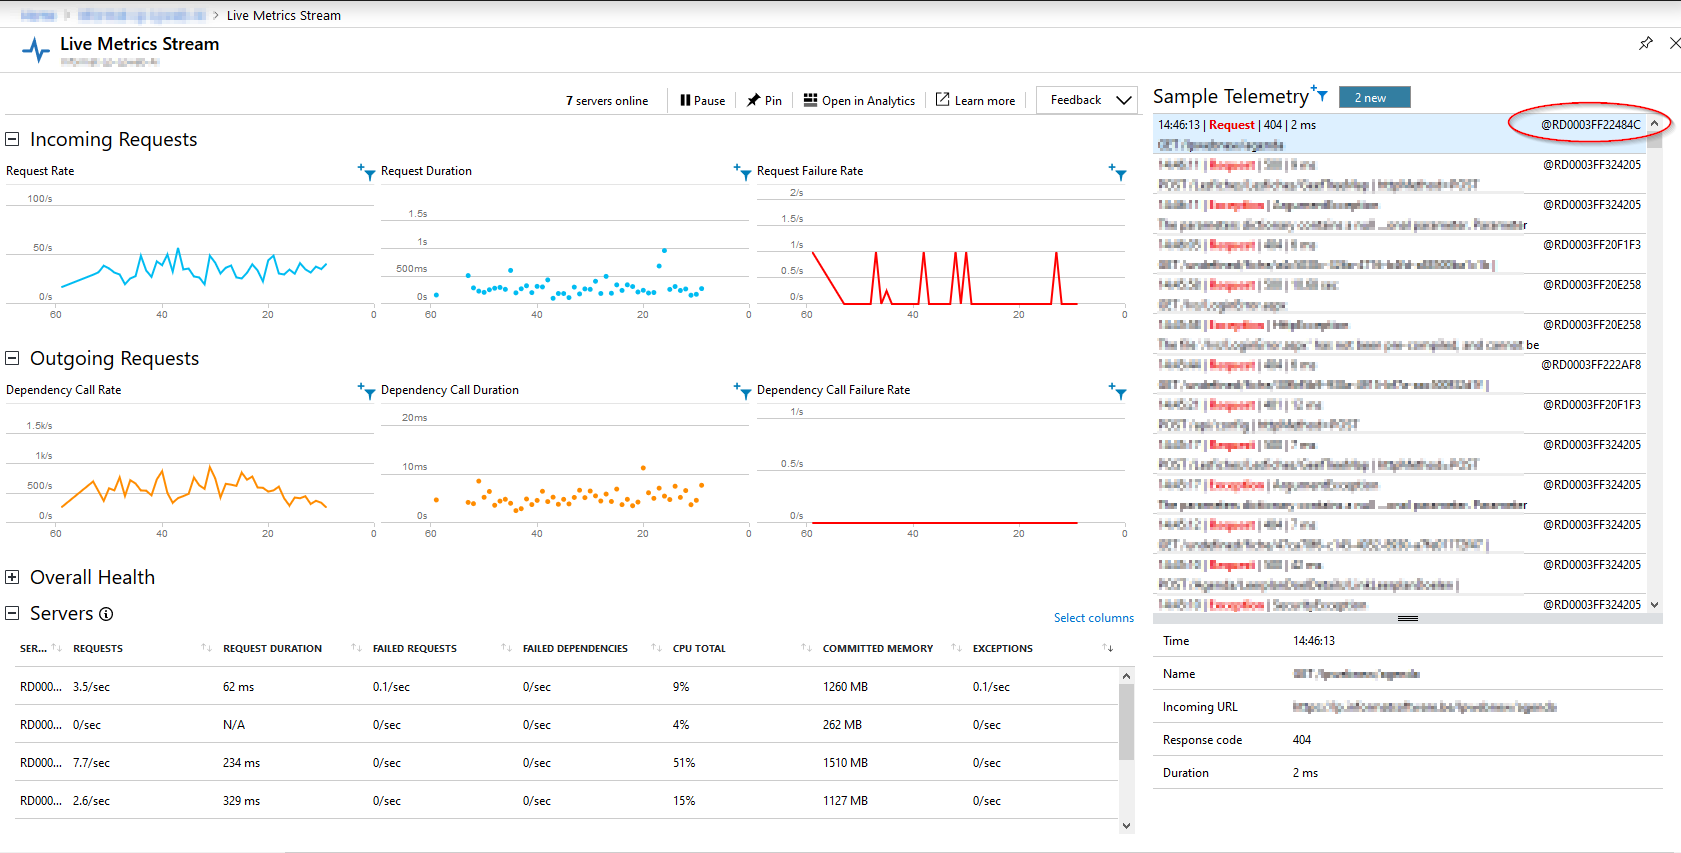
In case of this screenshot, the instance name is RD0003FF22484C, but that will be different for your case. There are other ways of detecting what instance is the naughty one. For example, you can use the application insights search option, or any other way to find the instance name.
Requesting the memory dump
You should request the memory dump while the mischief is happening. A memory dump is a snapshot of threads and memory of the running web app and does not contain historical data. Getting a memory dump when the error is no longer happening is pointless.
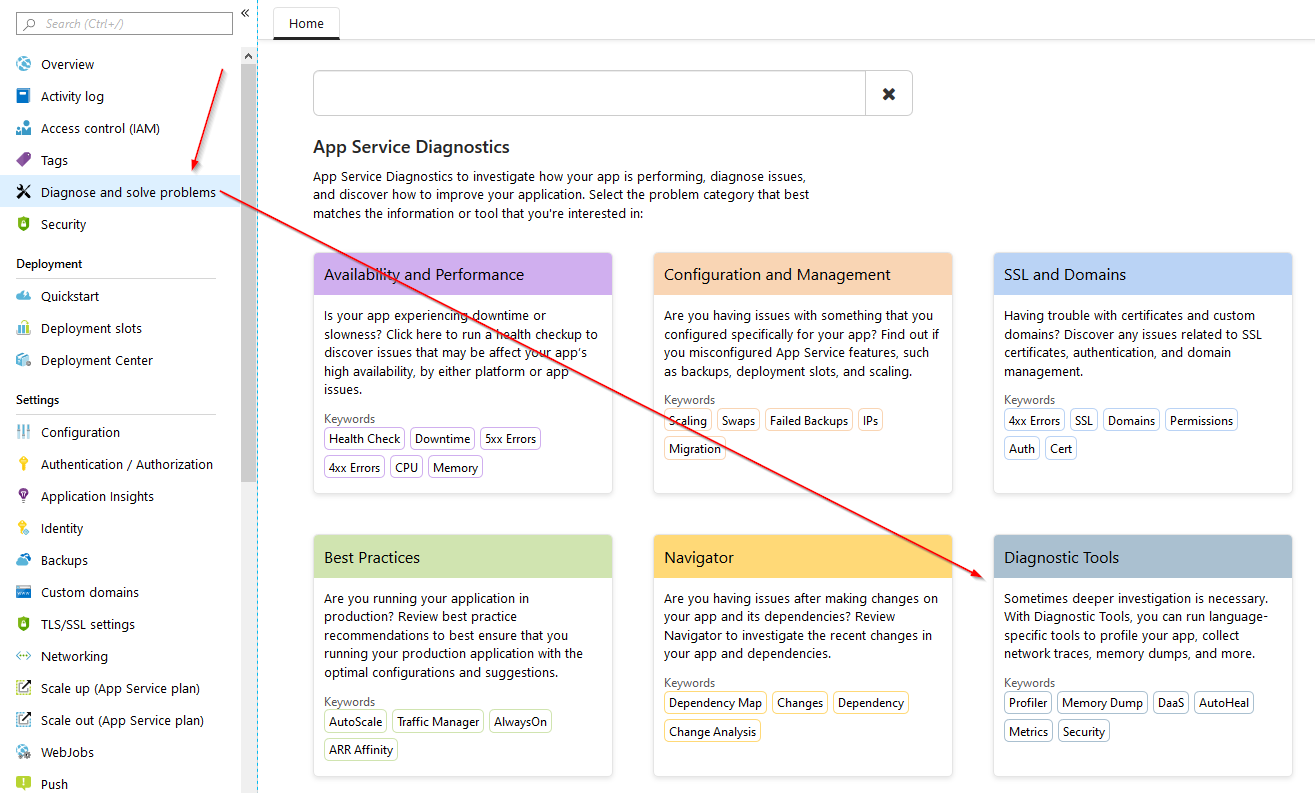
To request the memory dump, you need to open the web app diagnostic tools. To do this, you open your Web App page in Azure, click “Diagnose and solve problems”, and click “Diagnostic Tools.”
The App Service Diagnostics Tools and Resources house a few handy resources. The ones I use most are the “Collect Memory Dump”, “Collect .NET Profiler Trace” and “Advanced Application Restart”. All of these tools prove to be very handy from time to time, and one should keep them in mind at all times when your application is doing the dirty thing.
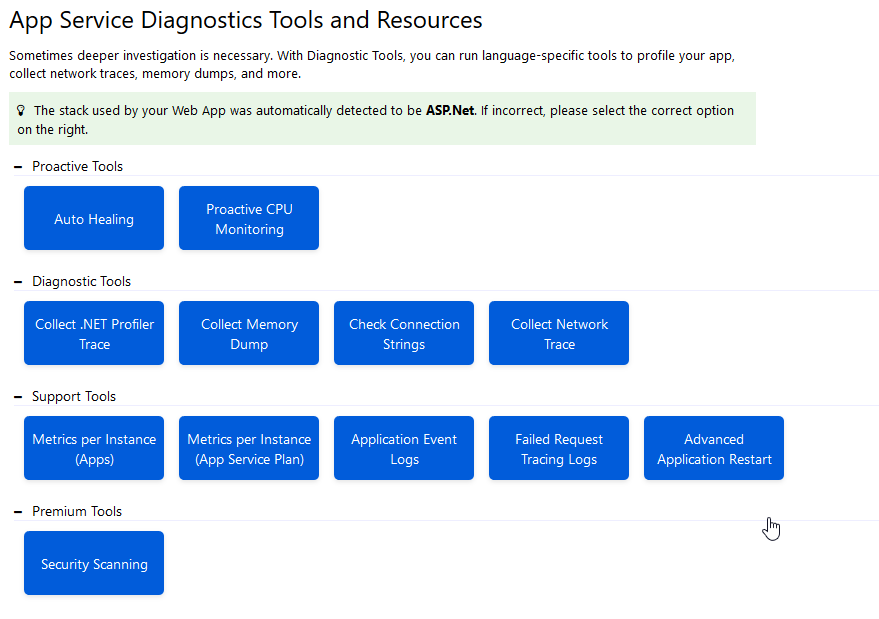
As you can guess, the tool we are going to use is going to be the “Collect Memory Dump” one. After we successfully created a memory dump, we can restart only the one specific bogus instance using “Advanced Application Restart”. Doing so limits the impact of the restart.
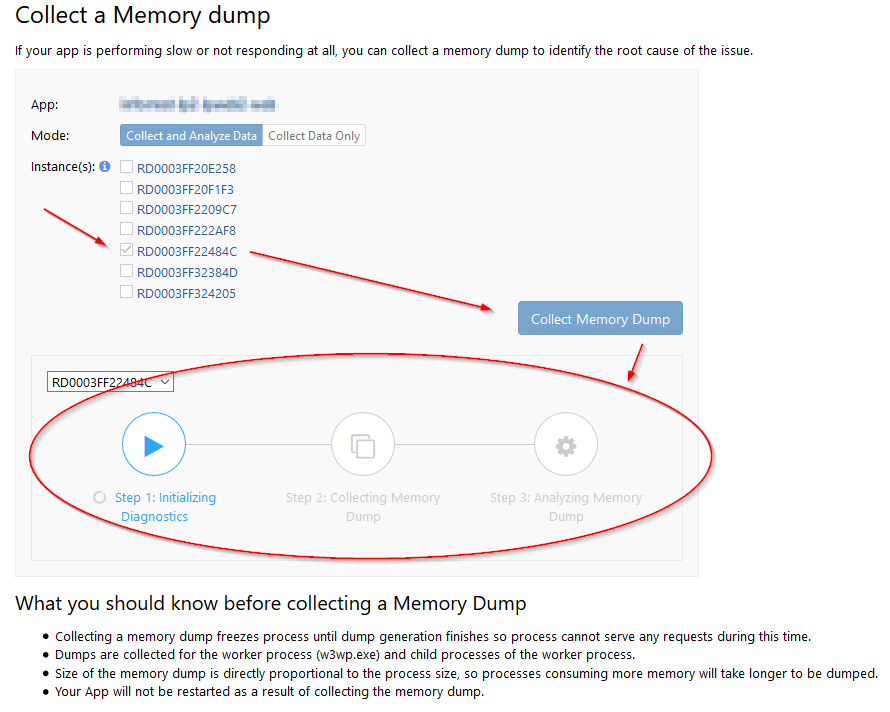
Starting the memory dump is as easy as selecting the instance you want the dump for, clicking “Collect Memory Dump” and wait until all three steps are done. In mode, you can opt to skip the “Analyze Data” step; I tend not to do it because all inputs of data analysis are helpful.
Creation of a memory dump can take a while, depending on how much memory your application is munching. In my case, the dump was about 3GB big and took quite a while to create.
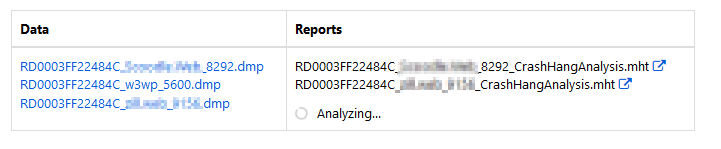
You can open the “Azure analysis” on the right of the screen. The dumps themselves show on the right. For our next steps, we are going to need the dump on our hard drive, so download away.
Step two: getting more tools
For my analysis today, I made use of two tools. The first tool was JetBrains dotMemory, and the other one is WinDbg. Lastly, I’ve downloaded two extensions: one called SOSex and another called MEX
My experience with these tools is that dotMemory is a friendly general analysis tool to pinpoint problems generally. With WinDbg, you can dig deep into the data, but it is hard to have a general overview of what is happening.
Below is a screenshot of both dotMemory and WinDbg and the difference in the user interface is very clear.
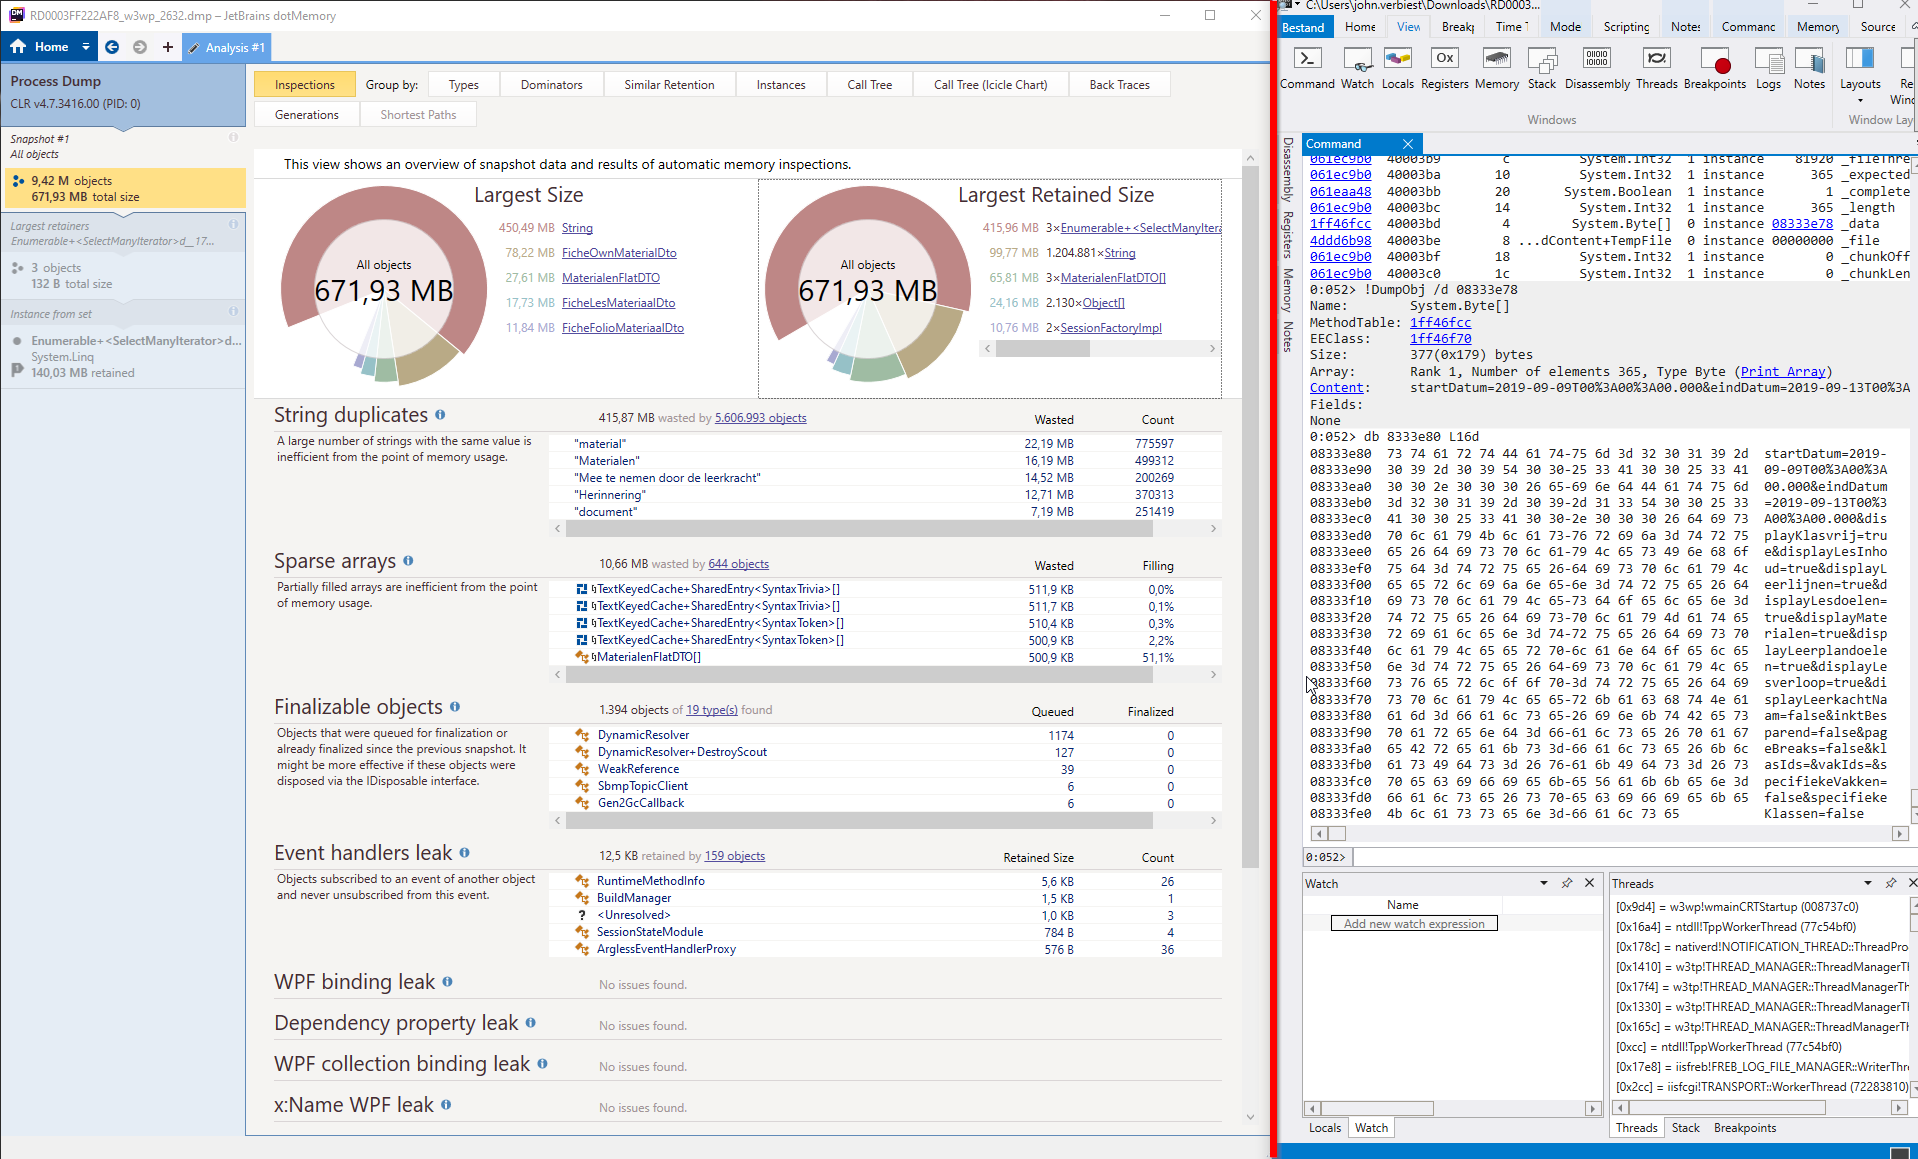
To be specific: dotMemory is on the left of the red line, WinDbg on the right.
Step 3: General analysis with dotMemory
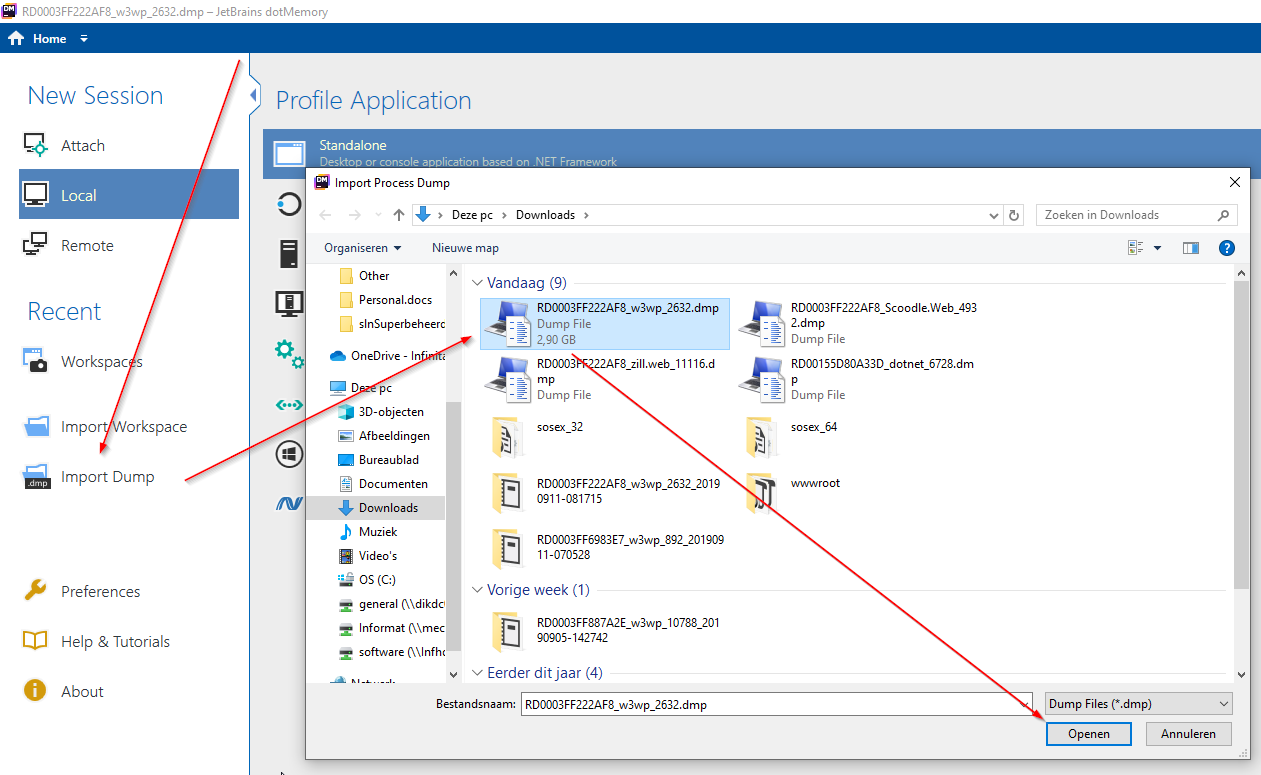
To open our memory dump, click “Import Dump”, select the correct file, and click “Open”.
It will show some screens and do some initial analytics. After you went through them you should see something like this:
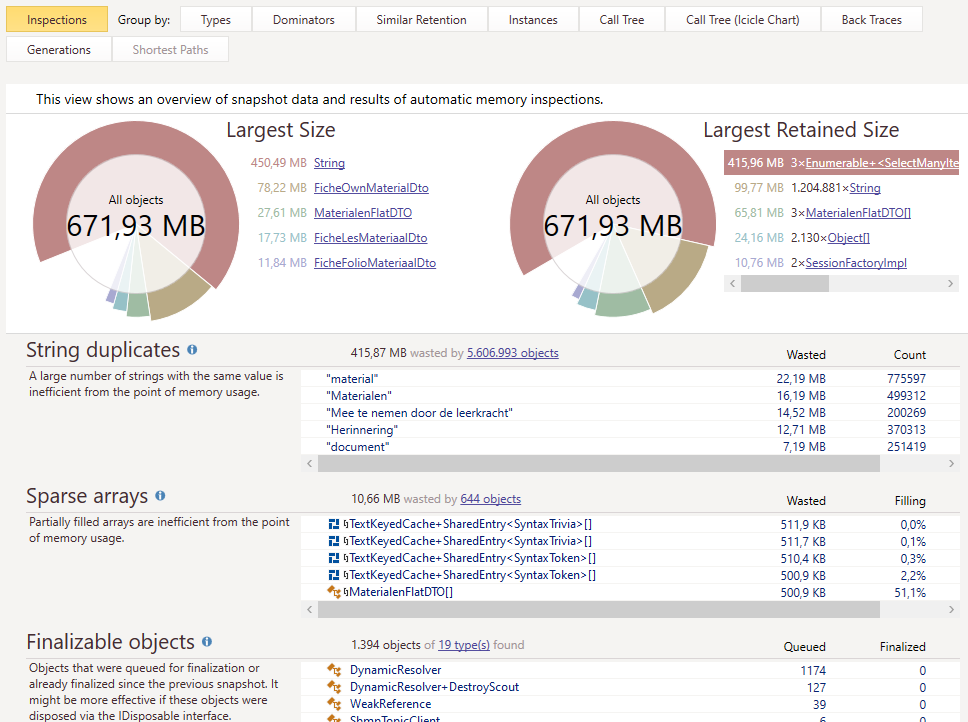
It was quite obvious there was a problem. There is 450.49 MB worth of string data in memory. Another problem that pops up is that three objects in memory hold about 415.96MB of data. That can’t be a coincidence.
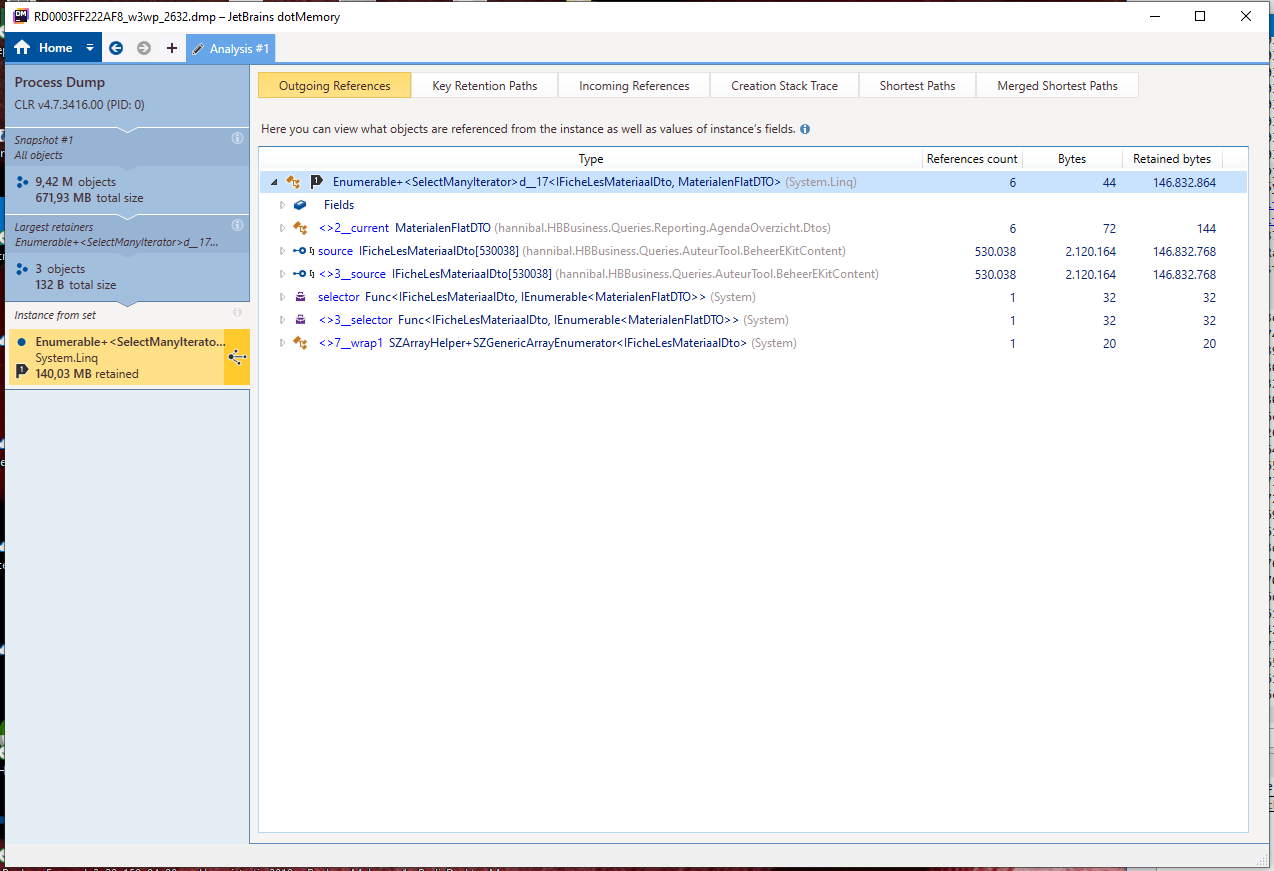
By clicking the “3xEnumerable…”, followed by opening one of those three, I got the data above. In the list there are 530 038 items, accounting to more than 146Mb of data for a single API call. Adding the knowledge that at the time this memory dump was taken, there were three of those lists; there could be only one conclusion. This list must be the cause of the problem.
Sadly dotMemory did not allow me to pinpoint what call caused this situation, so a deeper dive had to be taken, straight into the deep waters of WinDbg.
Step 4: The deep waters of WinDbg
Part 1: Downloading SOS.dll from Azure Web App
Before we can start debugging, we need the SOS tools. There is a SOS.dll on your machine, but sadly it’s the wrong one. We need the one from the Azure Web App.
The dll can be downloaded very easily (ahem). Here is how:
- Go into the kudu site of your web app
- Open the debug console (CMD) and type following command: pushd D:\Windows\Microsoft.NET to go to the hidden folder
- Go into the 32 or 64bit folder of “Framework”, depending on your needs (trial and error is the way I do this)
- In that folder, open the “v4.0.30319” folder
- Download sos.dll from this folder, and save it somewhere convenient and not too deep in the folder tree on your local machine. Do remember where you saved it”
See, that was not hard at all, very user-friendly. Thanks Microsoft!
Part two: loading all the things
First of all, it is time to start WinDbg. When you have this open (and you use the GUI version of it), start with opening the memory dump by dragging the file into the WinDbg screen.
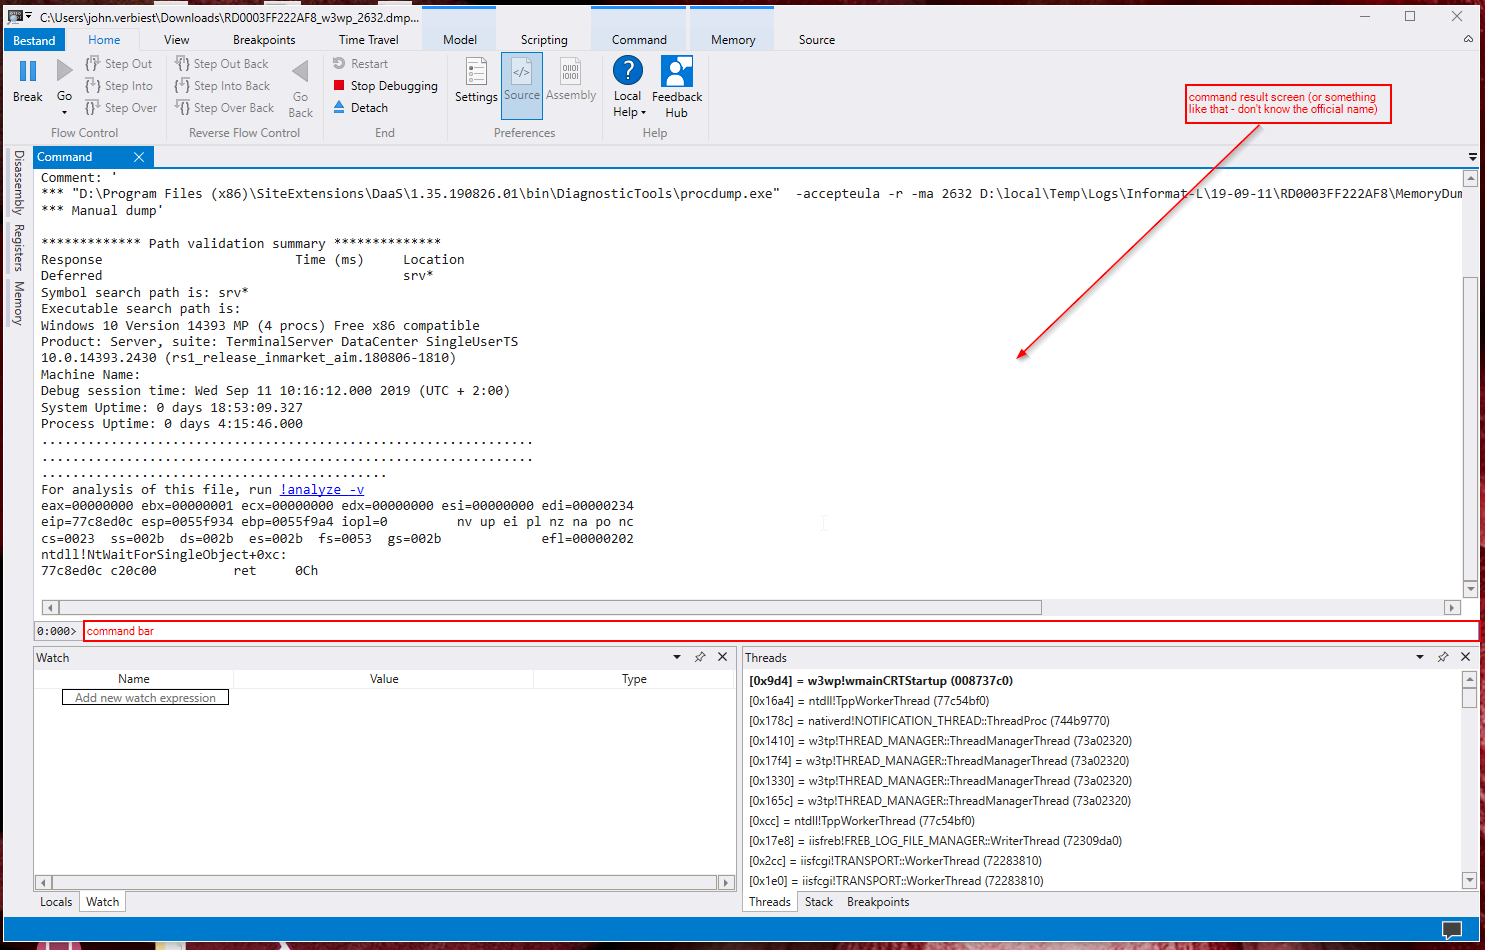
If opened, your screen will look a bit like above. You type commands in the command bar, and you see the results above that. And now the fun begins!
.load C:\Users\john.verbiest\Downloads\SOS(1).dll type this command to load the SOS tools from Azure (replace the path with the correct one, and yes, it starts with a dot). If all is good, you will see no response at all.
.load C:\Users\john.verbiest\Downloads\sosex_32\sosex.dll type this command to load the extensions. Replace the path, and if you did it all correctly, you get no response.
Ready to dive? Let’s go!
Look at that heap!
If you want to debug something that went wrong with the heap, it might be a good idea to get a summary of how the heap looks. If you execute !dumpheap -stat you will get an ordered list of all the types that are in memory. The list is ordered by size ascending, so the more memory a specific type uses, the lower it will show. In our case, the end of the list looked like this:
      MT    Count    TotalSize Class Name
9d953db8    56181      2696688 <Unloaded Type>
051c24bc    72780      2911200 NHibernate.Engine.EntityKey
8b50c27c    56184      2921568 NHibernate.Proxy.DefaultLazyInitializer
21410cc8    54141      2921816 System.Int32[]
216086e4    63677      3820620 System.Reflection.RuntimeMethodInfo
216a60c0   260011      4160176 System.Collections.DictionaryEntry
1ff44d20   174422      4337152 System.String[]
79aa8eac        5      6360516 hannibal.HBBusiness.Queries.AuteurTool.BeheerEKitContent.IFicheLesMateriaalDto[]
061ea28c   208428      7705356 System.Object[]
1ff46fcc    60768      9108281 System.Byte[]
7984edfc   193914     12410496 hannibal.HBBusiness.Queries.AuteurTool.BeheerEKitContent.FicheFolioMateriaalDto
7984f06c   172152     18592416 hannibal.HBBusiness.Queries.AuteurTool.BeheerEKitContent.FicheLesMateriaalDto
794d8638   402027     28945944 hannibal.HBBusiness.Queries.Reporting.AgendaOverzicht.Dtos.MaterialenFlatDTO
7984ec10  1206213     82022484 hannibal.HBBusiness.Queries.AuteurTool.BeheerEKitContent.FicheOwnMaterialDto
064fcaa8   608533     87955734      Free
061efd98  5831585    505948476 System.String
Total 11400232 objects
Fragmented blocks larger than 0.5 MB:
    Addr     Size      Followed by
d5ddf8e0   11.5MB         d6953548 System.Threading.OverlappedData
de0e77b4    5.4MB         de6583b4 System.Byte[]
de6a5830    1.1MB         de7c4630 System.String
de7c6488    5.0MB         decbb76c System.Byte[]
Again we see in this view that there are way too many strings in the system. But furthermore, the next few types are viral as well, counting more than one million of type “FicheOwnMaterialDto”. (The first column of that list is the Method Table, where the methods on that type are stored - we don’t need this at the moment, but you can use it to see compiled code). If you click on the link that method table represents you will get a list of the instances of that specific type. As it was 1.2 million instances, it took me quite some time to get the list.
Clicking a random instance (the first column) made WinDbg execute !DumpObj /d d260197c. This command shows the object located at address d260197c. It gave me this:
Name:        hannibal.HBBusiness.Queries.AuteurTool.BeheerEKitContent.FicheOwnMaterialDto
MethodTable: 7984ec10
EEClass:     7981eb7c
Size:        68(0x44) bytes
File:        D:\local\Temporary ASP.NET Files\scoodle\a9371f3b\c1a73863\assembly\dl3\40209bed\00ca9cb9_e266d501\hannibal.HBBusiness.dll
Fields:
      MT    Field   Offset                 Type VT     Attr    Value Name
211dcc10  4000f10       20          System.Guid  1 instance d260199c <Id>k__BackingField
061efd98  4000f11        4        System.String  0 instance ae09aaec <Naam>k__BackingField
061efd98  4000f12        8        System.String  0 instance 00000000 <Url>k__BackingField
211dcc10  4000f13       30          System.Guid  1 instance d26019ac <FicheId>k__BackingField
061efd98  4000f14        c        System.String  0 instance ae09ab10 <MateriaalType>k__BackingField
061eaa48  4000f15       1c       System.Boolean  1 instance        0 <CanHaveFile>k__BackingField
7b082380  4000f16       10 ...in.Common.Bestand  0 instance 00000000 <Bestand>k__BackingField
061efd98  4000f17       14        System.String  0 instance 00000000 <Verwijzing>k__BackingField
061efd98  4000f18       18        System.String  0 instance ae09ab30 <Beschrijving>k__BackingField
Handy as this data could be, I actually needed the parent of this object. To get this I used !gcroot d260197c. This will look for the root object of this one. Result:
Thread 1b84:
    4fcbecfc 4700f9db System.Linq.Enumerable+<SelectManyIterator>d__17`2[[System.__Canon, mscorlib],[System.__Canon, mscorlib]].MoveNext()
        esi:
            ->  0884b810 System.Linq.Enumerable+<SelectManyIterator>d__17`2[[hannibal.HBBusiness.Queries.AuteurTool.BeheerEKitContent.IFicheLesMateriaalDto, hannibal.HBBusiness],[hannibal.HBBusiness.Queries.Reporting.AgendaOverzicht.Dtos.MaterialenFlatDTO, hannibal.HBBusiness]]
            ->  18aacb70 hannibal.HBBusiness.Queries.AuteurTool.BeheerEKitContent.IFicheLesMateriaalDto[]
            ->  d260197c hannibal.HBBusiness.Queries.AuteurTool.BeheerEKitContent.FicheOwnMaterialDto

Found 1 unique roots (run '!GCRoot -all' to see all roots).
This gave me something I really needed: the thread id. Lets put WinDbg into that thread: ~~[1b84]s.
Now that we are in the correct thread, we can do more with the CLR. How about getting the current stack? !clrstack gives the following:
OS Thread Id: 0x1b84 (52)
Child SP       IP Call Site
4fcbe968 73b68423 [HelperMethodFrame: 4fcbe968]
4fcbe9dc 216b0e7a System.String.ConcatArray(System.String[], Int32)
4fcbe9f8 23ea737c System.String.Concat(System.Object[])
4fcbea14 8b55979c NHibernate.Engine.Cascade.CascadeOn(NHibernate.Persister.Entity.IEntityPersister, System.Object, System.Object)
4fcbea58 8b5594ad NHibernate.Event.Default.AbstractFlushingEventListener.CascadeOnFlush(NHibernate.Event.IEventSource, NHibernate.Persister.Entity.IEntityPersister, System.Object, System.Object)
4fcbea8c 8b5590f7 NHibernate.Event.Default.AbstractFlushingEventListener.PrepareEntityFlushes(NHibernate.Event.IEventSource)
 ....... omitted .......
4fcbf15c 4e152882 System.Web.HttpApplication+CallHandlerExecutionStep.System.Web.HttpApplication.IExecutionStep.Execute()
4fcbf198 4d513b05 System.Web.HttpApplication.ExecuteStepImpl(IExecutionStep)
4fcbf1ac 4d513854 System.Web.HttpApplication.ExecuteStep(IExecutionStep, Boolean ByRef)
4fcbf1ec 4d5105fc System.Web.HttpApplication+PipelineStepManager.ResumeSteps(System.Exception)
4fcbf2c8 4ddcfd7d System.Web.HttpApplication.BeginProcessRequestNotification(System.Web.HttpContext, System.AsyncCallback)
4fcbf2e0 4ddca879 System.Web.HttpRuntime.ProcessRequestNotificationPrivate(System.Web.Hosting.IIS7WorkerRequest, System.Web.HttpContext)
4fcbf324 4ddc9224 System.Web.Hosting.PipelineRuntime.ProcessRequestNotificationHelper(IntPtr, IntPtr, IntPtr, Int32)
4fcbf328 4ddc8a08 [InlinedCallFrame: 4fcbf328]
4fcbf420 4ddc8a08 System.Web.Hosting.PipelineRuntime.ProcessRequestNotification(IntPtr, IntPtr, IntPtr, Int32)
4fcbf4f8 0537f17a [ContextTransitionFrame: 4fcbf4f8]
this is a hell of a lot of data you should not read, but it shows you have the full stack trace of this thread and something to start working with. More useful (and with more data) is the following command: !clrstack -l -p. This will give you the same stack, but with all locals (-l) and all properties (-p) included. I will only show the most interesting one below:
4fcbee7c ad198f5c hannibal.HBWeb.Areas.Agenda.Controllers.AgendaAfdrukController.AgendaOverzicht(hannibal.HBBusiness.Queries.Reporting.AgendaOverzicht.AgendaOverzichtReportDataQuery)
    PARAMETERS:
        this (<CLR reg>) = 0x0833340c
        dataQuery = <no data>
    LOCALS:
        <no data>
        <no data>
This is the controller of the api and is a good starting point to know more. Right now I’m looking for the URI that was used to get here.
Clicking on the address next to the “this” parameter, we open the object and can start exploring the memory space.
Name:        hannibal.HBWeb.Areas.Agenda.Controllers.AgendaAfdrukController
MethodTable: 7914e310
EEClass:     7913c3a4
Size:        72(0x48) bytes
File:        D:\local\Temporary ASP.NET Files\scoodle\a9371f3b\c1a73863\assembly\dl3\0736780f\00bc75b2_e266d501\hannibal.HBWeb.dll
Fields:
      MT    Field   Offset                 Type VT     Attr    Value Name
8b135040  4000153        4 ...c.SingleEntryGate  0 instance 083334d0 _executeWasCalledGate
98d061f0  4000154        8 ...iewDataDictionary  0 instance 00000000 _dynamicViewDataDictionary
79377bd8  4000155        c ...empDataDictionary  0 instance 0833362c _tempDataDictionary
061eaa48  4000156       1c       System.Boolean  1 instance        1 _validateRequest
79377ca8  4000157       10 ...vc.IValueProvider  0 instance 0833539c _valueProvider
79377e8c  4000158       14 ...iewDataDictionary  0 instance ae030e64 _viewDataDictionary
73747220  4000159       18 ...ControllerContext  0 instance 08333584 <ControllerContext>k__BackingField
8b134fc4  40001e6       20 ...sync.AsyncManager  0 instance 08333454 _asyncManager
793777e0  40001e7       24 ...vc.IActionInvoker  0 instance 08333758 _actionInvoker
74d9cc24  40001e8       28 ...lBinderDictionary  0 instance 00000000 _binders
4d4f6170  40001e9       2c ...g.RouteCollection  0 instance 00000000 _routeCollection
79377844  40001ea       30 ...ITempDataProvider  0 instance 08333668 _tempDataProvider
760efb44  40001eb       34 ...wEngineCollection  0 instance 00000000 _viewEngineCollection
76159534  40001ec       38 ...ependencyResolver  0 instance 00000000 _resolver
793779e8  40001ed       3c ...Web.Mvc.UrlHelper  0 instance 0833359c <Url>k__BackingField
061e6780  40001e4      138        System.Object  0   static 0fd021d8 _executeTag
061e6780  40001e5      13c        System.Object  0   static 0fd021e4 _executeCoreTag
760ed9ac  4000250       40 ....IQueryDispatcher  0 instance 0fca4938 queryDispatcher
When exploring these waters, it is important to note the difference between value and reference types. Everything you will see here are the value of a type, or the reference to the reference type. For example, you can see the value of the boolean value type as 1 (_validateRequest), but the _executeWasCalledgate is an object (reference type), so only the reference is shown here. You can, however, open the object by clicking the address.
To give myself a reference on how to proceed: opening the UrlHelper instance got me to this magic:
Name:        System.Web.Mvc.ControllerContext
MethodTable: 73747220
EEClass:     7375c9e8
Size:        24(0x18) bytes
File:        D:\local\Temporary ASP.NET Files\scoodle\a9371f3b\c1a73863\assembly\dl3\5f898403\00d8c3c0_e266d501\System.Web.Mvc.dll
Fields:
      MT    Field   Offset                 Type VT     Attr    Value Name
4701d3ac  40000d3        4 ...b.HttpContextBase  0 instance 16dbebe0 _httpContext
4837d548  40000d4        8 ...ng.RequestContext  0 instance 16dbed78 _requestContext
4837d650  40000d5        c ...Routing.RouteData  0 instance 16dbec40 _routeData
761501f8  40000d6       10 ...vc.ControllerBase  0 instance 0833340c <Controller>k__BackingField
And from here on you shall explore on your own. I managed to find the url and the parameters, and reproduce the issue this way.
Debugging with MEX
Everything above was before I’ve discovered MEX. With MEX it was much easier to get the data I’ve wanted. Mex adds a lot of missing functionality to debug .net code. Loading can be done by doing .load C:\windbg\x86\mex.dll or wherever you have installed mex into. A quick overview of its features:
!aspxpagesext
This awesome call gives you insights of all ASPX requests the server was doing at the time of the memory dump.
   Address  Completed Timeout Time (secs) ThreadId ReturnCode Verb Url
   06ce6788       yes   19200                             302 GET  <Url>
   06982728       yes   19200                             302 GET  <Url>
   06d589d8       yes   19200                             302 POST <Url>
   06e8b504       yes    7200                             304 GET  <Url>
SL 07a6cc44        no   19200        1148                 200 GET  <Url>
   07a707a4       yes    7200                             304 GET  <Url>
AS 0a9254c8        no       0       14478                 200 GET  <Url>
   0c1c0724       yes    7200                             304 GET  <Url>
84 contexts found (84 displayed).
   AS == possibly async request
   SL == session locked
I omitted some requests (this page is getting pretty long already), but you get the picture. Clicking through the addresses gives you nice overviews of the objects using !mex.DisplayObj
!tasktriage
This will list all the active tasks, and their status. Applying -t will only show the tasks for the current thread and -v will also list finished tasks.
Address    Target     Status                         Method                                                               Exceptions
====================================================================================================================================
cce51f64 |   <null> | TASK_STATE_RAN_TO_COMPLETION | <null>                                                             |     <none>
12949428 | 1294938c | TASK_STATE_DELEGATE_INVOKED  | Microsoft.ApplicationInsights.Channel.InMemoryTransmitter.Runner() |     <none>
db9c29f4 |   <null> | TASK_STATE_RAN_TO_COMPLETION | <null>                                                             |     <none>
0a962918 | 0a96276c | TASK_STATE_DELEGATE_INVOKED  | Microsoft.ApplicationInsights.Channel.InMemoryTransmitter.Runner() |     <none>
e3e01224 |   <null> | TASK_STATE_RAN_TO_COMPLETION | <null>                                                             |     <none>
e3e01140 |   <null> | TASK_STATE_RAN_TO_COMPLETION | <null>                                                             |     <none>
e3e19d10 |   <null> | TASK_STATE_RAN_TO_COMPLETION | <null>                                                             |     <none>
f2795fa8 |   <null> | TASK_STATE_RAN_TO_COMPLETION | <null>                                                             |     <none>
0ac27d5c | 0ac27bb0 | TASK_STATE_DELEGATE_INVOKED  | Microsoft.ApplicationInsights.Channel.InMemoryTransmitter.Runner() |     <none>
0ad31350 | 0ad311a4 | TASK_STATE_DELEGATE_INVOKED  | Microsoft.ApplicationInsights.Channel.InMemoryTransmitter.Runner() |     <none>
0b755f94 | 0b755eec | TASK_STATE_DELEGATE_INVOKED  | Microsoft.ApplicationInsights.Channel.InMemoryTransmitter.Runner() |     <none>
f27cd34c |   <null> | TASK_STATE_RAN_TO_COMPLETION | <null>                                                             |     <none>
f27cd268 |   <null> | TASK_STATE_RAN_TO_COMPLETION | <null>                                                             |     <none>
f27e7f4c |   <null> | TASK_STATE_RAN_TO_COMPLETION | <null>                                                             |     <none>
====================================================================================================================================
Address    Target     Status                         Method                                                               Exceptions
!dumpaspnetsession
With this command you are able to see the content of the session. However if you run session with Redis (as we do) you only get the session id and will get to be creative to get the rest.
0:042> !dumpaspnetsession -ctx 0x07594dcc
Failed Reading .NET heap object at 12f23258. Heap may be incomplete.
Could not find session 'ddasv1trqtdyn1wirt4teenx'
!mex.DisplayObj
Is an extended version of !dumpobject, with better deserialization and awesome views of objects.
0:052> !do 0x08331110
Name:        System.Collections.Hashtable
MethodTable: 213c08a8
EEClass:     211e8a6c
Size:        52(0x34) bytes
File:        D:\Windows\Microsoft.Net\assembly\GAC_32\mscorlib\v4.0_4.0.0.0__b77a5c561934e089\mscorlib.dll
Fields:
      MT    Field   Offset                 Type VT     Attr    Value Name
21411630  4001821        4 ...ashtable+bucket[]  0 instance 08331fcc buckets
061ec9b0  4001822       18         System.Int32  1 instance       33 count
061ec9b0  4001823       1c         System.Int32  1 instance       10 occupancy
061ec9b0  4001824       20         System.Int32  1 instance       64 loadsize
061edd50  4001825       24        System.Single  1 instance 0.720000 loadFactor
061ec9b0  4001826       28         System.Int32  1 instance       37 version
061eaa48  4001827       2c       System.Boolean  1 instance        0 isWriterInProgress
061e947c  4001828        8 ...tions.ICollection  0 instance 00000000 keys
061e947c  4001829        c ...tions.ICollection  0 instance 00000000 values
1ff488bc  400182a       10 ...IEqualityComparer  0 instance 0f39ae78 _keycomparer
061e6780  400182b       14        System.Object  0 instance 00000000 _syncRoot
Versus: 0:052> !DisplayObj 0x08331110 [raw] 08331110 System.Collections.Hashtable Entries: 3
Key: 08331c64 “schooldatabase” [14] (System.String) Value: 08331ccc (System.Collections.Specialized.NameObjectCollectionBase+NameObjectEntry)
Key: 08331f54 “displayNickname” [15] (System.String) Value: 08331fbc (System.Collections.Specialized.NameObjectCollectionBase+NameObjectEntry)
Key: 083312b4 “vestiging_id” [12] (System.String) Value: 08331314 (System.Collections.Specialized.NameObjectCollectionBase+NameObjectEntry)
Others
You can get a list of all the commands via !mex.help
Reading Redis Cache Values
Mex has support for reading InProc session data built-in. However it is not uncommon to put session data in a Redis Cache to support multiple machines. To read the sessiondata you will have to navigate a bit. Be sure to open your objects with !Mex.DisplayObj
- Navigate to the HTTPContext of the call you want to debug
- Open the object within
_sessionStateModule - Open the object within
_rqSessionState - Open the object within
_sessionItems - Open the object within
innerCollection - Open the object within
_entriesTable-> This is the list of key/value pairs for the session - Open the object within
Value, then againValue - Open the object within
_serializedvalue - Read the serialized (binary) value
Now what was the problem anyway?
We reasonably quickly found what we were looking for. There were 1 974 306 items of 4 specific types in memory, taking up 135MB. Because of this, the number of strings was going through the roof: 5 831 585 string taking up 505Mb of the stack. Knowing this process runs in a 32-bit environment, the stack only had 85Mb of free memory.
By doing a gcroot on one of the instances of one of the four types, I was able to find the thread these objects originated from.
The stack trace of this thread allowed me to open the HttpContext. From there, we needed to identify the call that led to this HttpContext. This can be found in the HttpRequest object in this HttpContext, together with the form data. For the session data, I’ve used the steps for Redis above.
After we identified the call, the session variables and the request body, we were able to reproduce the issue. For some reason, we noticed an intensive memory increase when we did the call. After some debugging, we found out there were some edge cases when a SQL query omitted a where clause. With no where clause the complete table got loaded into memory (and it was a massive table). Fixing this issue had a substantial positive impact on performance.
Final words
When your application gets to a state where it does no longer behave as expected, a memory dump can get useful. It is only helpful if you can make the dump during the error state of the application. When you are investigating high CPU usage, I would suggest other techniques such as a Trace Log.
I made this list of tools and techniques primarily for myself, so I can use it whenever an application goes bonkers on me. I will extend this blog post as I learn more about this topic.
Commands Cheat Sheet
| Command | Action |
|---|---|
| .load | loading tools |
| !clrstack | collapsed version of the CLR stack of current thread |
| !clrstack -l -p | CLR stack with locals and properties of current thread |
| ~~[1b84]s | Changing the current thread |
| !dumpheap -stat | statistics about the heap (# of types and usage) |
| !locks | finds the locks in the system |
| !VerifyHeap | validates managed heap integrity |
| !vmstat | shows info about the virtual memory |
| !dumpdomain | dumps out the applications domain |
| !threadpool | dumps out information on the clr thread pool |
| !gcroot | dumps out the reference chain of the object |
| !strings | dumps out all the strings |
| !threads | dumps out all threads and their last exception |
| !tasktriage | MEX - dump out all running tasks |
| !dumpaspnetsession | MEX - dump out aspnet session data (in Proc Only) |
| !aspxpagesext | MEX - dump out all aspnet running calls |
| !address -summary | dumps a summary of the memory usage |
